-
Carriage Services Announces Fourth Quarter and Full Year 2022 Results
Source: Nasdaq GlobeNewswire / 22 Feb 2023 16:37:06 America/New_York
HOUSTON, Feb. 22, 2023 (GLOBE NEWSWIRE) -- Carriage Services, Inc. (NYSE: CSV) today announced results for the fourth quarter and year ended December 31, 2022.
Company Highlights:
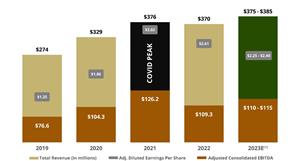
- 2022 full year performance compared to pre-COVID 2019 resulted in an impressive 10.5% compounded annual growth in total revenue and 27.8% compounded annual growth in adjusted diluted earnings per share;
- Our fourth quarter 2022 results exceeded internal expectations, as trends in all segments improved over the prior quarter, in part driven by a higher number of non-COVID-19 related deaths;
- We expect to close our transaction to acquire Greenlawn Funeral Homes and Cemeteries in Bakersfield, CA, within the next couple of weeks;
- Consistent with our High Performance and Credit Profile Restoration Plan, which we announced on December 12, 2022, our capital allocation priority for 2023 will be to pay down debt and decrease our leverage to a range of 4.0-4.3 times by the end of 2024;
- Strong financial revenue of more than $22 million for 2022 was highlighted by a positive return from our discretionary trust fund portfolio, as compared to broadly negative full year market comparables; and
- Moving forward, we will provide full year guidance at the beginning of each year, beginning with our 2023 outlook.
Mel Payne, Chairman and CEO, stated, “We are excited to report our 2022 full year results, as performance exceeded our expectations, particularly against a unique 2021, during which COVID related deaths hit a peak. We ended 2022 with an impressive 27.8% compounded annual growth of our adjusted diluted earnings per share when compared to 2019, which was the last full year before the COVID impact. Net income is up nearly 25% as compared to 2021 and we continue to see positive trends within both our funeral and cemetery segments.
This strong performance positions us well as we enter 2023 and continue to focus our capital allocation efforts on paying down debt, while we integrate our recent acquisitions, and build upon the momentum within our sales organization.
We have also been soliciting feedback from our shareholders and have made some changes to how we report our performance, beginning with this release. While we continue to pride ourselves on being transparent, we believe this new format will help simplify the communication of our performance. Additionally, as we look to continuously improve the way we communicate expectations, we will begin providing annual guidance at the beginning of each year and update that guidance, if necessary, on a quarterly basis.
While we held off on providing guidance during the fourth quarter of 2022, to better assess the normalization of the death rate, we are now comfortable announcing our 2023 full year outlook. Our 2023 outlook is built in connection with supporting the capital allocation priorities outlined in our High Performance and Credit Profile Restoration Plan, which we announced on December 12th. For 2023, we are forecasting total revenue in the range of $375-$385 million, adjusted consolidated EBITDA in the range of $110-$115 million, and adjusted diluted earnings per share in the range of $2.25-$2.40.
Since 2018, we have been hard at work adding new talent, particularly within our Senior Leadership Team, implementing a new sales team, building best in class support, and providing our leaders in the field with the tools necessary to serve families at the highest level while also competing for every call. As we enter 2023, we are excited to watch these strategic investments continue to drive our performance forward while we identify new opportunities to support and accelerate our growth,” concluded Mr. Payne.
FINANCIAL HIGHLIGHTS
Three Months Ended Years Ended December 31, December 31, (000’s except margins) 2021 2022 2021 2022 GAAP Metrics: Total revenue(1) $ 95,931 $ 93,916 $ 375,886 $ 370,174 Net income $ 13,347 $ 8,220 $ 33,159 $ 41,381 Net income margin 13.9 % 8.8 % 8.8 % 11.2 % Diluted EPS $ 0.77 $ 0.53 $ 1.81 $ 2.63 Cash provided by operating activities $ 14,547 $ 10,978 $ 84,246 $ 61,024 Non-GAAP Metrics: Adjusted consolidated EBITDA $ 30,395 $ 28,659 $ 126,161 $ 109,312 Adjusted consolidated EBITDA margin 31.7 % 30.5 % 33.6 % 29.5 % Adjusted diluted EPS $ 0.78 $ 0.64 $ 3.02 $ 2.61 Adjusted free cash flow $ 10,308 $ 8,904 $ 75,683 $ 49,792 (1) Total revenue is comprised of funeral operating revenue, cemetery operating revenue, divested revenue, ancillary revenue and financial revenue.
We present both GAAP and non-GAAP measures to provide investors with additional information. We believe that providing these non-GAAP measures along with GAAP measures allows for increased comparability of our ongoing performance from period to period. The most comparable GAAP measures to the Non-GAAP measures presented in this table can be found in the Reconciliation of Non-GAAP Financial Measures section of this press release.Since our December announcement of entering a definitive agreement to acquire Greenlawn Funeral Homes and Cemeteries in Bakersfield, CA, we have been working closely with the Greenlawn Team and expect to close that transaction, pending regulatory approval, within the next couple of weeks. The addition of Greenlawn, which is the market leader in Bakersfield, with a nearly 40% market share, continues our strategy of partnering with premier businesses located in large, growing markets.
As of December 31, 2022, our bank covenant compliance leverage ratio was 5.35 times. While we expect near term fluctuations in our debt leverage ratio, we are committed to our previously announced target and expect to reach a bank covenant compliance leverage ratio of approximately 4.7 times by the end of 2023 and 4.0-4.3 times by the end of 2024.
OPERATIONS UPDATE
Funeral Operations
Three Months Ended Years Ended December 31, December 31, (000’s except contracts and margins) 2021 2022 2021 2022 Funeral contracts 12,433 11,811 48,605 47,184 Funeral operating revenue $ 65,366 $ 63,964 $ 252,926 $ 251,396 Funeral operating EBITDA(1) $ 28,017 $ 26,874 $ 109,204 $ 101,951 Funeral operating EBITDA margin(1) 42.9 % 42.0 % 43.2 % 40.6 % (1)The most comparable GAAP measures to the Non-GAAP measures presented in this table can be found in the Reconciliation of Non-GAAP Financial Measures section of this press release.
Our funeral home segment exceeded our expectations in the fourth quarter of 2022, demonstrating the resilience of our decentralized business model even in challenging times. Despite experiencing a modest 2.1% decline in funeral operating revenue compared to the peak COVID-19 death impact in 2021, we are proud to report an impressive compounded annual growth rate (“CAGR”) of 8.6% versus our pre-COVID baseline in 2019. Although funeral contracts were down by 5.0% compared to the same quarter in 2021, we are pleased to note that our fourth quarter 2022 average revenue per contract increased by 2.9% over the same period in 2021. Funeral operating EBITDA also performed well, with a decrease of 4.1%, or $1.1 million, and funeral operating EBITDA margin was down 90 basis points to 42.0%. This is primarily due to our proactive efforts to mitigate inflationary costs within our control.
For the full year of 2022, we served 47,184 funeral contracts, representing a slight decrease of 2.9%. Despite this, our funeral operating revenue was $251.4 million, a decrease of 0.6%, and funeral operating EBITDA was $101.9 million, a decrease of 6.6%. Based on our fourth quarter performance, we are confident that we can continue driving organic growth and integrating our latest acquisitions while taking proactive measures to mitigate inflationary cost pressures. We are committed to delivering high-quality funeral services to our client families while providing exceptional value to our shareholders.
Cemetery Operations
Three Months Ended Years Ended December 31, December 31, (000’s except margins) 2021 2022 2021 2022 Cemetery preneed sales $ 15,958 $ 15,696 $ 65,116 $ 62,178 Cemetery operating revenue $ 22,461 $ 23,169 $ 91,330 $ 90,033 Cemetery operating EBITDA(1) $ 10,019 $ 9,910 $ 42,158 $ 37,509 Cemetery operating EBITDA margin(1) 44.6 % 42.8 % 46.2 % 41.7 % (1)The most comparable GAAP measures to the Non-GAAP measures presented in this table can be found in the Reconciliation of Non-GAAP Financial Measures section of this press release.
For the fourth quarter of 2022, our cemetery operating revenue grew by 3.2% compared to last year. Even through a challenging economic environment, our cemetery operating EBITDA experienced a slight decline of 1.1% due to the proactive measures taken by our field leaders to manage the impact of inflationary costs, leading to a cemetery operating EBITDA margin decrease of 180 basis points to 42.8% compared to the same quarter of the previous year, we remain confident in our ability to navigate these headwinds. We recorded a $0.4 million increase in recognized cemetery property revenue when compared to the same period in 2021, despite preneed property sales decreasing by $0.5 million or 3.8%.
For the full year, cemetery operating revenue ended at $90 million, down by 1.4% compared to 2021, and cemetery operating EBITDA was $37.5 million, down by 11%. The decline in cemetery operating EBITDA was driven primarily by inflationary operating costs that started at the beginning of the second quarter of 2022. However, we are encouraged by our fourth quarter performance, which indicates that the measures we have taken should continue to produce positive results.
Looking ahead, we anticipate that our preneed sales organization will continue to mature, and we expect preneed sales to grow by low double digits above 2022 levels. It is worth noting that since 2019, when we positioned ourselves to build and support our High Performance Sales Organization, our cemetery operating revenue has experienced a CAGR of 22.2%. We are optimistic about the future of our cemetery portfolio and are confident that we will continue to grow and thrive in the years to come.
TRUST FUND PERFORMANCE
YTD 2022 Annualized
2009 - 2022CSV Discretionary portfolio 0.6% 13.3% S&P 500 (18.1)% 13.1% DJIA (6.9)% 12.7% NASDAQ (32.5)% 15.8% HY Bond index (11.2)% 8.9% Our discretionary trust fund portfolio returned 10.0% in the fourth quarter of 2022, versus 7.5% for the S&P 500 and 4.2% for the High Yield Bond index. On a full year basis, the portfolio had a positive return of 0.6%, while all four indices posted negative returns. The allocation of our portfolio was roughly 46% fixed income, 43% equities, and 11% cash as of December 31, 2022.
Since 2020, our portfolio has generated approximately $46.5 million in net capital gains, including $13.0 million of gains recorded in 2022. Our total recurring annual income is up nearly 19% to $20.8 million at the end of 2022 from $17.5 million in the previous year, and represents an 8.4% yield on the portfolio’s total market value of $246.3 million as of December 31, 2022.
While the markets ended 2022 on a negative note as concerns about inflation, higher interest rates, and future economic growth drove volatility throughout the year, the performance of our portfolio outperformed as we maintained focus on various income-driven investments as well as some non-income investments in the energy sector.
OUTLOOK FOR 2023
(in millions - except per share amounts) 2023 Outlook Total revenue $375 - $385 Adjusted consolidated EBITDA $110 - $115 Adjusted diluted earnings per share $2.25 - $2.40 Adjusted free cash flow $50 - $60 A photo accompanying this announcement is available at https://www.globenewswire.com/NewsRoom/AttachmentNg/81f0c2c3-8f07-4c48-934f-7d6c4aef7d7a
(1 ) Includes ten months of proforma EBITDA from the Greenlawn acquisition expected to close in late February/early March 2023. Lower earnings per share is primarily due to higher interest expense when compared to 2022 and increased overhead costs related to our digital transformation investments. CALL AND INVESTOR RELATIONS CONTACT
Carriage Services has scheduled a conference call for tomorrow, February 23, 2023 at 9:30 a.m. central time. To participate live over the phone via audio conferencing click link or live over the Internet via webcast click link. An audio archive of the call will be available on demand via the Company’s website at www.carriageservices.com. For any investor relations questions, please email InvestorRelations@carriageservices.com.
CARRIAGE SERVICES, INC. CONDENSED OPERATING AND FINANCIAL TREND REPORT (in thousands - except per share amounts) 2018 2019 2020 2021 2022 Funeral operating revenue $ 190,098 $ 196,475 $ 226,819 $ 252,926 $ 251,396 Cemetery operating revenue 44,588 49,317 69,083 91,330 90,033 Financial revenue 15,688 15,878 19,689 22,708 22,452 Ancillary revenue — 748 4,661 4,437 4,193 Divested/planned divested revenue 17,618 11,689 9,196 4,485 2,100 Total revenue $ 267,992 $ 274,107 $ 329,448 $ 375,886 $ 370,174 Funeral operating EBITDA $ 71,727 $ 75,553 $ 93,480 $ 109,204 $ 101,951 Funeral operating EBITDA margin 37.7 % 38.5 % 41.2 % 43.2 % 40.6 % Cemetery operating EBITDA 13,844 17,164 26,627 42,158 37,509 Cemetery operating EBITDA margin 31.0 % 34.8 % 38.5 % 46.2 % 41.7 % Financial EBITDA 14,139 14,272 18,357 21,156 20,767 Financial EBITDA margin 90.1 % 89.9 % 93.2 % 93.2 % 92.5 % Ancillary EBITDA — 298 1,186 1,006 841 Ancillary EBITDA margin — % 39.8 % 25.4 % 22.7 % 20.1 % Divested/planned divested EBITDA 4,603 2,480 2,292 1,117 293 Divested/planned divested EBITDA margin 26.1 % 21.2 % 24.9 % 24.9 % 14.0 % Total EBITDA $ 104,313 $ 109,767 $ 141,942 $ 174,641 $ 161,361 Total EBITDA margin 38.9 % 40.0 % 43.1 % 46.5 % 43.6 % Total overhead $ 36,993 $ 37,554 $ 40,514 $ 54,282 $ 53,848 Overhead as a percentage of revenue 13.8 % 13.7 % 12.3 % 14.4 % 14.5 % Consolidated EBITDA $ 67,320 $ 72,213 $ 101,428 $ 120,359 $ 107,513 Consolidated EBITDA margin 25.1 % 26.3 % 30.8 % 32.0 % 29.0 % Other expenses and interest Depreciation & amortization $ 17,430 $ 17,771 $ 19,389 $ 20,520 $ 19,799 Non-cash stock compensation 6,583 2,153 3,370 5,513 5,959 Interest expense 21,109 25,522 32,515 25,445 25,895 Loss on extinguishment of debt 502 — 6 23,807 190 Other 3,430 4,351 21,506 770 (1,524 ) Pretax income $ 18,266 $ 22,416 $ 24,642 $ 44,304 $ 57,194 Net tax expense 6,621 7,883 8,552 11,145 15,813 Net income $ 11,645 $ 14,533 $ 16,090 $ 33,159 $ 41,381 Special items(1) $ 11,650 $ 9,821 $ 25,579 $ 30,607 $ (200 ) Tax effect on special items 1,729 1,822 7,986 8,503 95 Adjusted net income $ 21,566 $ 22,532 $ 33,683 $ 55,263 $ 41,086 Adjusted net income margin 8.0 % 8.2 % 10.2 % 14.7 % 11.1 % Adjusted basic earnings per share $ 1.19 $ 1.26 $ 1.88 $ 3.17 $ 2.76 Adjusted diluted earnings per share $ 1.17 $ 1.25 $ 1.86 $ 3.02 $ 2.61 GAAP basic earnings per share $ 0.64 $ 0.81 $ 0.90 $ 1.90 $ 2.78 GAAP diluted earnings per share $ 0.63 $ 0.80 $ 0.89 $ 1.81 $ 2.63 Weighted average shares o/s - basic 17,971 17,877 17,872 17,409 14,857 Weighted average shares o/s - diluted 18,374 18,005 18,077 18,266 15,710 Reconciliation of Consolidated EBITDA to Adjusted consolidated EBITDA Consolidated EBITDA $ 67,320 $ 72,213 $ 101,428 $ 120,359 $ 107,513 Special items(1) 2,872 4,374 2,822 5,802 1,799 Adjusted consolidated EBITDA $ 70,192 $ 76,587 $ 104,250 $ 126,161 $ 109,312 Adjusted consolidated EBITDA margin 26.2 % 27.9 % 31.6 % 33.6 % 29.5 % (1) A detail of our Special items presented in this table can be found in the Reconciliation of Non-GAAP Financial Measures section of this press release.
CARRIAGE SERVICES, INC. CONDENSED CONSOLIDATED BALANCE SHEET (in thousands) December 31, 2021 2022 ASSETS Current assets: Cash and cash equivalents $ 1,148 $ 1,170 Accounts receivable, net 25,314 24,458 Inventories 7,346 7,613 Prepaid and other current assets 6,404 4,733 Total current assets 40,212 37,974 Preneed cemetery trust investments 100,903 95,065 Preneed funeral trust investments 113,658 104,553 Preneed cemetery receivables, net 23,150 26,672 Receivables from funeral preneed trusts, net 19,009 19,976 Property, plant and equipment, net 269,367 278,106 Cemetery property, net 100,701 104,170 Goodwill 391,972 410,137 Intangible and other non-current assets, net 29,378 32,930 Operating lease right-of-use assets 17,881 17,060 Cemetery perpetual care trust investments 72,400 66,307 Total assets $ 1,178,631 $ 1,192,950 LIABILITIES AND STOCKHOLDERS’ EQUITY Current liabilities: Current portion of debt and lease obligations $ 2,809 $ 3,172 Accounts payable 14,205 11,675 Accrued and other liabilities 43,773 30,621 Total current liabilities 60,787 45,468 Acquisition debt, net of current portion 3,979 3,438 Credit facility 153,857 188,836 Senior notes 394,610 395,243 Obligations under finance leases, net of current portion 5,157 4,743 Obligations under operating leases, net of current portion 18,520 17,315 Deferred preneed cemetery revenue 50,202 51,746 Deferred preneed funeral revenue 30,584 32,029 Deferred tax liability 45,784 48,820 Other long-term liabilities 1,419 3,065 Deferred preneed cemetery receipts held in trust 100,903 95,065 Deferred preneed funeral receipts held in trust 113,658 104,553 Care trusts’ corpus 71,156 65,495 Total liabilities 1,050,616 1,055,816 Commitments and contingencies: Stockholders’ equity: Common stock 263 264 Additional paid-in capital 236,809 238,780 Retained earnings 135,462 176,843 Treasury stock (244,519 ) (278,753 ) Total stockholders’ equity 128,015 137,134 Total liabilities and stockholders’ equity $ 1,178,631 $ 1,192,950 CARRIAGE SERVICES, INC. CONSOLIDATED STATEMENTS OF OPERATIONS (in thousands, except per share data) (unaudited) Three Months Ended Years Ended December 31, December 31, 2021 2022 2021 2022 Revenue: Service revenue $ 46,486 $ 45,992 $ 180,572 $ 181,271 Property and merchandise revenue 42,176 41,475 167,721 161,970 Other revenue 7,269 6,449 27,593 26,933 95,931 93,916 375,886 370,174 Field costs and expenses: Cost of service 21,322 21,517 82,395 87,322 Cost of merchandise 29,199 29,149 113,871 116,453 Cemetery property amortization 1,457 1,545 6,670 5,859 Field depreciation expense 3,177 3,485 12,609 13,316 Regional and unallocated funeral and cemetery costs 7,191 5,551 25,846 22,960 Other expenses 1,221 1,231 4,979 5,038 63,567 62,478 246,370 250,948 Gross profit 32,364 31,438 129,516 119,226 Corporate costs and expenses: General, administrative and other 9,850 9,348 35,190 37,471 Net (gain) loss on divestitures, disposals and impairment charges (711 ) 2,462 666 2,029 Operating income 23,225 19,628 93,660 79,726 Interest expense (5,307 ) (7,687 ) (25,445 ) (25,895 ) Loss on extinguishment of debt — (190 ) (23,807 ) (190 ) Gain on insurance reimbursements — 196 — 3,471 Other, net 3 4 (104 ) 82 Income before income taxes 17,921 11,951 44,304 57,194 Expense for income taxes (4,850 ) (3,665 ) (12,316 ) (16,243 ) Tax adjustment related to discrete items 276 (66 ) 1,171 430 Total expense for income taxes (4,574 ) (3,731 ) (11,145 ) (15,813 ) Net income $ 13,347 $ 8,220 $ 33,159 $ 41,381 Basic earnings per common share: $ 0.82 $ 0.56 $ 1.90 $ 2.78 Diluted earnings per common share: $ 0.77 $ 0.53 $ 1.81 $ 2.63 Dividends declared per common share: $ 0.1125 $ 0.1125 $ 0.4125 $ 0.4500 Weighted average number of common and common equivalent shares outstanding: Basic 16,233 14,707 17,409 14,857 Diluted 17,400 15,418 18,266 15,710 CARRIAGE SERVICES, INC. CONSOLIDATED STATEMENTS OF CASH FLOWS (in thousands) Years Ended December 31, 2021 2022 Cash flows from operating activities: Net income $ 33,159 $ 41,381 Adjustments to reconcile net income to net cash provided by operating activities: Depreciation and amortization 20,520 19,799 Provision for credit losses 1,783 2,818 Stock-based compensation expense 5,513 5,959 Deferred income tax expense (benefit) (692 ) 3,036 Amortization of intangibles 1,285 1,286 Amortization of debt issuance costs 576 552 Amortization and accretion of debt 439 493 Loss on extinguishment of debt 23,807 190 Net loss on divestitures, disposals and impairment charges 847 2,029 Gain on insurance reimbursements — (3,471 ) Other — (155 ) Changes in operating assets and liabilities that provided (used) cash: Accounts and preneed receivables (4,090 ) (5,358 ) Inventories, prepaid and other current assets (4,449 ) 2,295 Intangible and other non-current assets (1,181 ) (1,917 ) Preneed funeral and cemetery trust investments (31,349 ) (17,679 ) Accounts payable 522 (101 ) Accrued and other liabilities 3,485 (9,120 ) Deferred preneed funeral and cemetery revenue 5,010 1,302 Deferred preneed funeral and cemetery receipts held in trust 29,061 17,685 Net cash provided by operating activities 84,246 61,024 Cash flows from investing activities: Acquisitions of businesses and real estate (3,285 ) (33,876 ) Proceeds from divestitures and sale of other assets 7,875 5,027 Proceeds from insurance reimbursements 7,758 2,440 Capital expenditures (24,883 ) (26,081 ) Net cash used in investing activities (12,535 ) (52,490 ) Cash flows from financing activities: Borrowings from the credit facility 266,168 155,400 Payments against the credit facility (157,968 ) (120,100 ) Payment to redeem the senior notes due 2026 (400,000 ) — Payment of call premium for redemption of the senior notes due 2026 (19,876 ) — Proceeds from the issuance of the senior notes due 2029 395,500 — Payment of debt issuance costs related to the credit facility and senior notes due 2029 (2,197 ) (922 ) Conversion and maturity of the convertible notes (3,980 ) — Payments on acquisition debt and obligations under finance leases (1,331 ) (882 ) Payments on contingent consideration recorded at acquisition date (461 ) — Proceeds from the exercise of stock options and employee stock purchase 2,644 1,745 Taxes paid on restricted stock vestings and exercise of stock options (2,647 ) (327 ) Dividends paid on common stock (7,264 ) (6,763 ) Purchase of treasury stock (140,040 ) (36,663 ) Net cash used in financing activities (71,452 ) (8,512 ) Net increase in cash and cash equivalents 259 22 Cash and cash equivalents at beginning of year 889 1,148 Cash and cash equivalents at end of year $ 1,148 $ 1,170 NON-GAAP FINANCIAL MEASURES
This press release uses Non-GAAP financial measures to present the financial performance of the Company. Our Non-GAAP reporting provides a transparent framework of our operating and financial performance that reflects the earning power of the Company as an operating and consolidation platform.
Non-GAAP financial measures should be viewed in addition to, and not as an alternative for, the Company’s reported operating results or cash flow from operations or any other measure of performance as determined in accordance with GAAP. We believe the Non-GAAP results are useful to investors to compare our results to previous periods, to provide insight into the underlying long-term performance trends in our business and to provide the opportunity to differentiate ourselves as the best consolidation platform in the industry against the performance of other funeral and cemetery companies.
Reconciliations of the Non-GAAP financial measures to GAAP measures are also provided in this press release.
The Non-GAAP financial measures used in this press release and the definitions of them used by the Company for our internal management purposes in this press release are described below.
- Special items are defined as charges or credits included in our GAAP financial statements that can vary from period to period and are not reflective of costs incurred in the ordinary course of our operations. The change in uncertain tax reserves and other was not tax effected. Special items were taxed at the operating tax rate.
- Adjusted net income is defined as net income after adjustments for special items that we believe do not directly reflect our core operations and may not be indicative of our normal business operations.
- Adjusted net income margin is defined as adjusted net income as a percentage of total revenue.
- Consolidated EBITDA is defined as net income before income taxes, interest expenses, non-cash stock compensation, depreciation and amortization, and interest income and other, net.
- Consolidated EBITDA margin is defined as consolidated EBITDA as a percentage of total revenue.
- Adjusted consolidated EBITDA is defined as consolidated EBITDA after adjustments for special items that we believe do not directly reflect our core operations and may not be indicative of our normal business operations.
- Adjusted consolidated EBITDA margin is defined as adjusted consolidated EBITDA as a percentage of total revenue.
- Adjusted free cash flow is defined as cash provided by operating activities, adjusted by special items as deemed necessary, less cash for maintenance capital expenditures.
- Adjusted free cash flow margin is defined as adjusted free cash flow as a percentage of total revenue.
- Funeral operating EBITDA is defined as funeral gross profit, plus depreciation and amortization and regional and unallocated costs, less financial EBITDA, ancillary EBITDA and divested/planned divested EBITDA related to the Funeral Home segment.
- Funeral operating EBITDA margin is defined as funeral operating EBITDA as a percentage of funeral operating revenue.
- Cemetery operating EBITDA is defined as cemetery gross profit, plus depreciation and amortization and regional and unallocated costs, less financial EBITDA and divested/planned divested EBITDA related to the Cemetery segment.
- Cemetery operating EBITDA margin is defined as cemetery operating EBITDA as a percentage of cemetery operating revenue.
- Preneed cemetery sales is defined as cemetery property, merchandise and services sold prior to death.
- Financial EBITDA is defined as financial revenue, less the related expenses. Financial revenue and the related expenses are presented within Other revenue and Other expenses, respectively, on the Consolidated Statement of Operations.
- Financial EBITDA margin is defined as financial EBITDA as a percentage of financial revenue.
- Ancillary revenue is defined as revenues from our ancillary businesses, which include a flower shop, pet cremation business and online cremation business. Ancillary revenue and the related expenses are presented within Other revenue and Other expenses, respectively, on the Consolidated Statement of Operations.
- Ancillary EBITDA is defined as ancillary revenue, less expenses related to our ancillary businesses noted above.
- Ancillary EBITDA margin is defined as ancillary EBITDA as a percentage of ancillary revenue.
- Divested/planned divested revenue is defined as revenues from certain funeral home and cemetery businesses that we have divested and intend to divest.
- Divested/planned divested EBITDA is defined as divested/planned divested revenue, less field level and financial expenses related to the divested/planned divested businesses noted above.
- Divested/planned divested EBITDA margin is defined as divested/planned divested EBITDA as a percentage of divested/planned divested revenue.
- Total EBITDA is the sum of funeral operating EBITDA, cemetery operating EBITDA, financial EBITDA, ancillary EBITDA and divested/planned divested EBITDA.
- Total EBITDA margin is defined as total EBITDA as a percentage of total revenue.
- Adjusted basic earnings per share (EPS) is defined as GAAP basic earnings per share, adjusted for special items.
- Adjusted diluted earnings per share (EPS) is defined as GAAP diluted earnings per share, adjusted for special items.
- Total debt outstanding is defined as indebtedness under our senior notes due 2029, acquisition debt, finance leases and bank credit facility, including our letter of credit.
- Proforma trailing twelve months of adjusted consolidated EBITDA is defined as trailing twelve months of adjusted consolidated EBITDA including proforma EBITDA for our 2022 acquisitions, as well as add backs for deferred purchase price payments made during the last twelve months.
- Bank covenant compliance leverage ratio is defined as total debt outstanding to proforma trailing twelve months of adjusted consolidated EBITDA.
Funeral Operating EBITDA and Cemetery Operating EBITDA
Our operations are reported in two business segments: Funeral Home operations and Cemetery operations. Our operating level results highlight trends in volumes, revenue, operating EBITDA (the individual business’ cash earning power/locally controllable business profit) and operating EBITDA margin (the individual business’ controllable profit margin).
Funeral operating EBITDA and cemetery operating EBITDA are defined above. Funeral and cemetery gross profit is defined as revenue less “field costs and expenses” — a line item encompassing these areas of costs: i) funeral and cemetery field costs, ii) field depreciation and amortization expense, and iii) regional and unallocated funeral and cemetery costs. Funeral and cemetery field costs include cost of service, funeral and cemetery merchandise costs, operating expenses, labor and other related expenses incurred at the business level.
Regional and unallocated funeral and cemetery costs presented in our GAAP statement consist primarily of salaries and benefits of our regional leadership, incentive compensation opportunity to our field employees and other related costs for field infrastructure. These costs, while necessary to operate our businesses as currently operated within our unique, decentralized platform, are not controllable operating expenses at the field level as the composition, structure and function of these costs are determined by executive leadership in the Houston Support Center. These costs are components of our overall overhead platform presented within consolidated EBITDA and adjusted consolidated EBITDA. We do not directly or indirectly “push down” any of these expenses to the individual business’ field level margins.
We believe that our “regional and unallocated funeral and cemetery costs” are necessary to support our decentralized, high performance culture operating framework, and as such, are included in consolidated EBITDA and adjusted consolidated EBITDA, which more accurately reflects the cash earning power of the Company as an operating and consolidation platform.
Consolidated EBITDA and Adjusted Consolidated EBITDA
Consolidated EBITDA and adjusted consolidated EBITDA are defined above. Our adjusted consolidated EBITDA include adjustments for special items that we believe do not directly reflect our core operations and may not be indicative of our normal business operations.
How These Measures Are Useful
When used in conjunction with GAAP financial measures, our total EBITDA, consolidated EBITDA and adjusted consolidated EBITDA are supplemental measures of operating performance that we believe are useful measures to facilitate comparisons to our historical consolidated and business level performance and operating results.
We believe our presentation of adjusted consolidated EBITDA, a key metric used internally by our management, provides investors with a supplemental view of our operating performance that facilitates analysis and comparisons of our ongoing business operations because it excludes items that may not be indicative of our ongoing operating performance.
Limitations of the Usefulness of These Measures
Our total EBITDA, consolidated EBITDA and adjusted consolidated EBITDA are not necessarily comparable to similarly titled measures used by other companies due to different methods of calculation. Our presentation is not intended to be considered in isolation or as a substitute for, or superior to, the financial information prepared and presented in accordance with GAAP. Funeral operating EBITDA, cemetery operating EBITDA, financial EBITDA, ancillary EBITDA and divested/planned divested EBITDA are not consolidated measures of profitability.
Funeral and cemetery operating EBITDA excludes certain costs presented in our GAAP statement that we do not allocate to the individual business’ field level margins, as noted above. A reconciliation to funeral and cemetery gross profit, the most directly comparable GAAP measure, is set forth below.
Consolidated EBITDA excludes certain items that we believe do not directly reflect our core operations and may not be indicative of our normal business operations. A reconciliation to net income, the most directly comparable GAAP measure, is set forth below.
Therefore, these measures may not provide a complete understanding of our performance and should be reviewed in conjunction with our GAAP financial measures. Carriage Services strongly encourages investors to review the Company’s consolidated financial statements and publicly filed reports in their entirety and not rely on any single financial measure.
RECONCILIATION OF NON-GAAP FINANCIAL MEASURES
This press release includes the use of certain financial measures that are not GAAP measures. The Non-GAAP financial measures are presented for additional information and are reconciled to their most comparable GAAP measures, all of which are reflected in the tables below.
Reconciliation of Net Income to Consolidated EBITDA, Adjusted Consolidated EBITDA (in thousands) and Adjusted Consolidated EBITDA margin for the three months and years ended December 31, 2021 and 2022: Three Months Ended Years Ended December 31, December 31, 2021 2022 2021 2022 Net income $ 13,347 $ 8,220 $ 33,159 $ 41,381 Total expense for income taxes 4,574 3,731 11,145 15,813 Income before income taxes $ 17,921 $ 11,951 $ 44,304 $ 57,194 Depreciation & amortization 5,034 5,188 20,520 19,799 Non-cash stock compensation 1,681 1,381 5,513 5,959 Interest expense 5,307 7,687 25,445 25,895 Loss on extinguishment of debt — 190 23,807 190 Other (714 ) 2,262 770 (1,524 ) Consolidated EBITDA $ 29,229 $ 28,659 $ 120,359 $ 107,513 Adjusted for: Special items 1,166 — 5,802 1,799 Adjusted consolidated EBITDA $ 30,395 $ 28,659 $ 126,161 $ 109,312 Total revenue $ 95,931 $ 93,916 $ 375,886 $ 370,174 Adjusted consolidated EBITDA margin 31.7 % 30.5 % 33.6 % 29.5 % Reconciliation of Net Income to Consolidated EBITDA, Adjusted Consolidated EBITDA (in thousands) and Adjusted Consolidated EBITDA Margin for the years ended December 31, 2018, 2019 and 2020: 2018 2019 2020 Net income $ 11,645 $ 14,533 $ 16,090 Total expense for income taxes 6,621 7,883 8,552 Income before income taxes $ 18,266 $ 22,416 $ 24,642 Depreciation & amortization 17,430 17,771 19,389 Non-cash stock compensation 6,583 2,153 3,370 Interest expense 21,109 25,522 32,515 Other 3,932 4,351 21,512 Consolidated EBITDA $ 67,320 $ 72,213 $ 101,428 Adjusted for: Special items 2,872 4,374 2,822 Adjusted consolidated EBITDA $ 70,192 $ 76,587 $ 104,250 Total revenue $ 267,992 $ 274,107 $ 329,448 Adjusted consolidated EBITDA margin 26.2 % 27.9 % 31.6 % Special Items affecting Adjusted Net Income (in thousands) for the years ended December 31, 2018, 2019, 2020, 2021 and 2022: 2018 2019 2020 2021 2022 Acquisition expenses $ — $ 2,083 $ (11 ) $ — $ — Severance and separation costs 1,435 1,205 563 1,575 1,431 Performance awards cancellation and exchange 3,284 — 288 — — Accretion of discount on convert. sub, notes 2,192 241 216 20 — Net loss on extinguishment of debt 502 — — 23,807 190 Net (gain) loss on divestitures 556 4,217 6,864 (856 ) (543 ) Impairment of goodwill, intangibles and PPE 1,019 963 14,952 500 2,358 Litigation reserve 1,000 750 270 1,050 200 Tax expense related to divested business — 911 — — — Net gain on insurance reimbursements — (885 ) — — (3,471 ) Disaster recovery and pandemic costs 437 — 1,627 2,157 168 Change in uncertain tax reserves and other — — — — (533 ) Tax adjustment related to certain discrete items 1,225 — 400 — — Other special items — 336 410 2,354 — Total $ 11,650 $ 9,821 $ 25,579 $ 30,607 $ (200 ) Special Items affecting Adjusted Consolidated EBITDA (in thousands) for the years ended December 31, 2018, 2019, 2020, 2021 and 2022: 2018 2019 2020 2021 2022 Acquisition expenses $ — $ 2,083 $ (11 ) $ — $ — Severance and separation costs 1,435 1,205 563 1,575 1,431 Litigation reserve 1,000 750 270 1,050 200 Disaster recovery and pandemic costs 437 — 1,627 2,157 168 Other special items — 336 373 1,020 — Total $ 2,872 $ 4,374 $ 2,822 $ 5,802 $ 1,799 Reconciliation of Funeral and Cemetery Gross Profit to Funeral and Cemetery Operating EBITDA (in thousands) for the three months and years ended December 31, 2021 and 2022: Three Months Ended Years Ended December 31, December 31, 2021 2022 2021 2022 Funeral gross profit (GAAP) $ 22,377 $ 21,962 $ 89,027 $ 83,067 Depreciation & amortization 2,766 3,035 11,062 11,591 Regional & unallocated costs 5,419 4,414 18,918 16,813 Less: Funeral financial EBITDA (2,228 ) (2,174 ) (8,325 ) (8,484 ) Ancillary EBITDA (216 ) (281 ) (1,006 ) (841 ) Funeral divested/planned divested EBITDA (101 ) (82 ) (472 ) (195 ) Funeral operating EBITDA $ 28,017 $ 26,874 $ 109,204 $ 101,951 Funeral operating revenue $ 65,366 $ 63,964 $ 252,926 $ 251,396 Total funeral revenue $ 69,584 $ 67,830 $ 270,087 $ 266,903 Funeral operating EBITDA margin 42.9 % 42.0 % 43.2 % 40.6 % Funeral gross profit margin 32.2 % 32.4 % 33.0 % 31.1 % Three Months Ended Years Ended December 31, December 31, 2021 2022 2021 2022 Cemetery gross profit (GAAP) $ 9,987 $ 9,476 $ 40,489 $ 36,159 Depreciation & amortization 1,868 1,995 8,217 7,584 Regional & unallocated costs 1,772 1,137 6,928 6,147 Less: Cemetery financial EBITDA (3,479 ) (2,672 ) (12,831 ) (12,283 ) Cemetery divested/planned divested EBITDA (129 ) (26 ) (645 ) (98 ) Cemetery operating EBITDA $ 10,019 $ 9,910 $ 42,158 $ 37,509 Cemetery operating revenue $ 22,461 $ 23,169 $ 91,330 $ 90,033 Total cemetery revenue $ 26,347 $ 26,086 $ 105,799 $ 103,271 Cemetery operating EBITDA margin 44.6 % 42.8 % 46.2 % 41.7 % Cemetery gross profit margin 37.9 % 36.3 % 38.3 % 35.0 % Reconciliation of GAAP Basic Earnings Per Share to Adjusted Basic Earnings Per Share for the three months and years ended December 31, 2021 and 2022: Three Months Ended Years Ended December 31, December 31, 2021 2022 2021 2022 GAAP basic earnings per share $ 0.82 $ 0.56 $ 1.90 $ 2.78 Special items 0.01 0.12 1.27 (0.02 ) Adjusted basic earnings per share $ 0.83 $ 0.68 $ 3.17 $ 2.76 Reconciliation of GAAP Basic Earnings Per Share to Adjusted Basic Earnings Per Share for the years ended December 31, 2018, 2019 and 2020: 2018 2019 2020 GAAP basic earnings per share $ 0.64 $ 0.81 $ 0.90 Special items 0.55 0.45 0.98 Adjusted basic earnings per share $ 1.19 $ 1.26 $ 1.88 Reconciliation of GAAP Diluted Earnings Per Share to Adjusted Diluted Earnings Per Share for the three months and years ended December 31, 2021 and 2022: Three Months Ended Years Ended December 31, December 31, 2021 2022 2021 2022 GAAP diluted earnings per share $ 0.77 $ 0.53 $ 1.81 $ 2.63 Special items 0.01 0.11 1.21 (0.02 ) Adjusted diluted earnings per share $ 0.78 $ 0.64 $ 3.02 $ 2.61 Reconciliation of GAAP Diluted Earnings Per Share to Adjusted Diluted Earnings Per Share for the years ended December 31, 2018, 2019 and 2020: 2018 2019 2020 GAAP diluted earnings per share $ 0.63 $ 0.80 $ 0.89 Special items 0.54 0.45 0.97 Adjusted diluted earnings per share $ 1.17 $ 1.25 $ 1.86 Reconciliation of Cash Provided by Operating Activities to Adjusted Free Cash Flow (in thousands) for the three months and years ended December 31, 2021 and 2022: Three Months Ended, Years Ended December 31 December 31, 2021 2022 2021 2022 Cash provided by operating activities $ 14,547 $ 10,978 $ 84,246 $ 61,024 Cash used for maintenance capital expenditures (4,355 ) (2,074 ) (13,315 ) (11,784 ) Free cash flow $ 10,192 $ 8,904 $ 70,931 $ 49,240 Plus: incremental special items: Severance and separation costs $ — $ — $ 1,575 $ 384 Disaster recovery and pandemic costs 116 — 2,157 168 Other special items — — 1,020 — Adjusted free cash flow $ 10,308 $ 8,904 $ 75,683 $ 49,792 Reconciliation of Estimated Year Ended December 31, 2023: Reconciliation of Net Income to Consolidated EBITDA, Adjusted Consolidated EBITDA (in thousands) and Adjusted Consolidated EBITDA Margin for the year ended December 31, 2023: 2023E Net income $ 36,300 Total expense for income taxes 14,450 Income before income taxes $ 50,750 Depreciation & amortization 21,300 Non-cash stock compensation 7,800 Interest expense 33,100 Other — Consolidated EBITDA $ 112,950 Adjusted for: Special items — Adjusted consolidated EBITDA $ 112,950 Total revenue $ 380,000 Adjusted consolidated EBITDA margin 29.7 % Reconciliation of GAAP Diluted Earnings Per Share to Adjusted Diluted Earnings Per Share for the year ended December 31, 2023: 2023E GAAP diluted earnings per share $ 2.31 Special items — Adjusted diluted earnings per share $ 2.31 Reconciliation of Cash Provided by Operating Activities to Adjusted Free Cash Flow (in thousands) for the year ended December 31, 2023: 2023E Cash provided by operating activities $ 65,000 Cash used for maintenance capital expenditures (10,000 ) Free cash flow $ 55,000 Special items — Adjusted free cash flow $ 55,000 CAUTIONARY STATEMENT ON FORWARD-LOOKING STATEMENTS
Certain statements made herein or elsewhere by, or on behalf of, the Company that are not historical facts are intended to be forward-looking statements within the meaning of Section 27A of the Securities Act of 1933, as amended, and Section 21E of the Securities Exchange Act of 1934, as amended. In addition to historical information, this Press Release contains certain statements and information that may constitute forward-looking statements within the safe harbor provisions of the Private Securities Litigation Reform Act of 1995. All statements, other than statements of historical information, should be deemed to be forward-looking statements. These statements include, but are not limited to, statements regarding any projections of earnings, revenue, cash flow, investment returns, capital allocation, debt levels, equity performance, death rates, market share growth, overhead, including talent recruitment, field and corporate incentive compensation, or other financial items; any statements of the plans, strategies and objectives of management for future operations or financing activities, including, but not limited, to capital allocation, the ability to obtain credit or financing, organizational performance, anticipated integration, performance and other benefits of recently completed and anticipated acquisitions, and cost and debt reductions; any statements of the plans, timing and objectives of management for acquisition activities; any statements regarding future economic conditions or performance; any statements of belief; and any statements of assumptions underlying any of the foregoing and are based on our current expectations and beliefs concerning future developments and their potential effect on us. The words “may”, “will”, “estimate”, “intend”, “believe”, “expect”, “seek”, “project”, “forecast”, “foresee”, “should”, “would”, “could”, “plan”, “anticipate” and other similar words or expressions are intended to identify forward-looking statements, which are generally not historical in nature. While management believes that these forward-looking statements are reasonable as and when made, there can be no assurance that future developments affecting us will be those that we anticipate. All comments concerning our expectations for future revenue and operating results are based on our forecasts for our existing operations and do not include the potential impact of any future acquisitions, except where specifically noted. Our forward-looking statements involve significant risks and uncertainties (some of which are beyond our control) and assumptions that could cause actual results to differ materially from our historical experience and our present expectations or projections. Important factors that could cause actual results to differ materially from those in the forward-looking statements include, but are not limited to, those summarized below:
- our ability to find and retain skilled personnel;
- the effects of our talent recruitment efforts, incentive and compensation plans and programs, including such effects on our Standards Operating Model and the Company’s operational and financial performance;
- our ability to execute our growth strategy;
- our ability to execute and meet the objectives of our High Performance and Credit Profile Restoration Plan, if at all;
- the execution of our Standards Operating, 4E Leadership and Standard Acquisition Models;
- the effects of competition;
- changes in the number of deaths in our markets;
- changes in consumer preferences and our ability to adapt to or meet those changes;
- our ability to generate preneed sales, including implementing our cemetery portfolio sales strategy, product development and optimization plans;
- the investment performance of our funeral and cemetery trust funds;
- fluctuations in interest rates;
- the effects of inflation on our business and financial condition and performance, including increased overall costs for our goods and services, the impact on customer preferences as a result of changes in discretionary income, and our ability, if at all, to mitigate such effects;
- our ability to obtain debt or equity financing on satisfactory terms to fund additional acquisitions, expansion projects, working capital requirements and the repayment or refinancing of indebtedness;
- our ability to meet the timing, objectives and expectations related to our capital allocation framework, including our forecasted rates of return, planned uses of free cash flow and future capital allocation, including share repurchases, potential strategic acquisitions, internal growth projects, dividend increases, or debt repayment plans;
- our ability to meet the projected financial and equity performance goals to our updated full year outlook, if at all;
- the timely and full payment of death benefits related to preneed funeral contracts funded through life insurance contracts;
- the financial condition of third-party insurance companies that fund our preneed funeral contracts;
- increased or unanticipated costs, such as insurance or taxes;
- our level of indebtedness and the cash required to service our indebtedness;
- changes in federal income tax laws and regulations and the implementation and interpretation of these laws and regulations by the Internal Revenue Service;
- effects of the application of other applicable laws and regulations, including changes in such regulations or the interpretation thereof;
- the potential impact of epidemics and pandemics, including the COVID-19 coronavirus, including new variants of COVID-19, such as the Delta and Omicron variants, on customer preferences and on our business;
- government, social, business and other actions that have been and will be taken in response to pandemics, including potential responses to new variants of COVID-19, such as the Delta and Omicron variants;
- effects and expense of litigation;
- consolidation of the funeral and cemetery industry;
- our ability to identify and consummate strategic acquisitions, if at all, and successfully integrate acquired businesses with our existing businesses, including expected performance and financial improvements related thereto;
- economic, financial and stock market fluctuations,
- interruptions or security lapses of our information technology, including any cybersecurity or ransomware incidents,
- our failure to maintain effective control over financial reporting; and
- other factors and uncertainties inherent in the funeral and cemetery industry.
For additional information regarding known material factors that could cause our actual results to differ from our projected results, please see “Risk Factors” in our Annual Report on Form 10-K for the year ended December 31, 2021, our Quarterly Reports on Form 10-Q, and other public filings and press releases, available at www.carriageservices.com.
Investors are cautioned not to place undue reliance on forward-looking statements, which speak only as of the date hereof. We undertake no obligation to publicly update or revise any forward-looking statements after the date they are made, whether as a result of new information, future events or otherwise.


OUTLOOK FOR 2023
OUTLOOK FOR 2023